The standing answer to where DeFi yield is worth taking. Every position on the board carries a Safety Score, the mechanism that produces the yield, and the specific thing that would break it. Reviewed and revised every month; previous editions are archived.

Current edition: October 2026. Rewritten in the last week of each preceding month. Nothing here is financial advice.
Best risk-adjusted yield: the October PT on USD.AI — 10.04% at a Strategy Safety Score of 80.
The one trade with a deadline: mint PT + YT on the October USDai market and keep both legs, before the points season closes on 15 October.
The hurdle: 6% — what a custodial consumer account pays today, with no smart-contract risk.
Highest payers, lowest scores: the levered STRC wrappers at the bottom of the board.
The rules that hold every edition: prefer a fixed rate to a floating one when they pay the same; an incentive is not a yield; at high leverage the borrow rate, not the collateral, is what liquidates you.
Bitcoin went up through two pieces of news that should have sent it down, and that is the whole regime in one sentence.
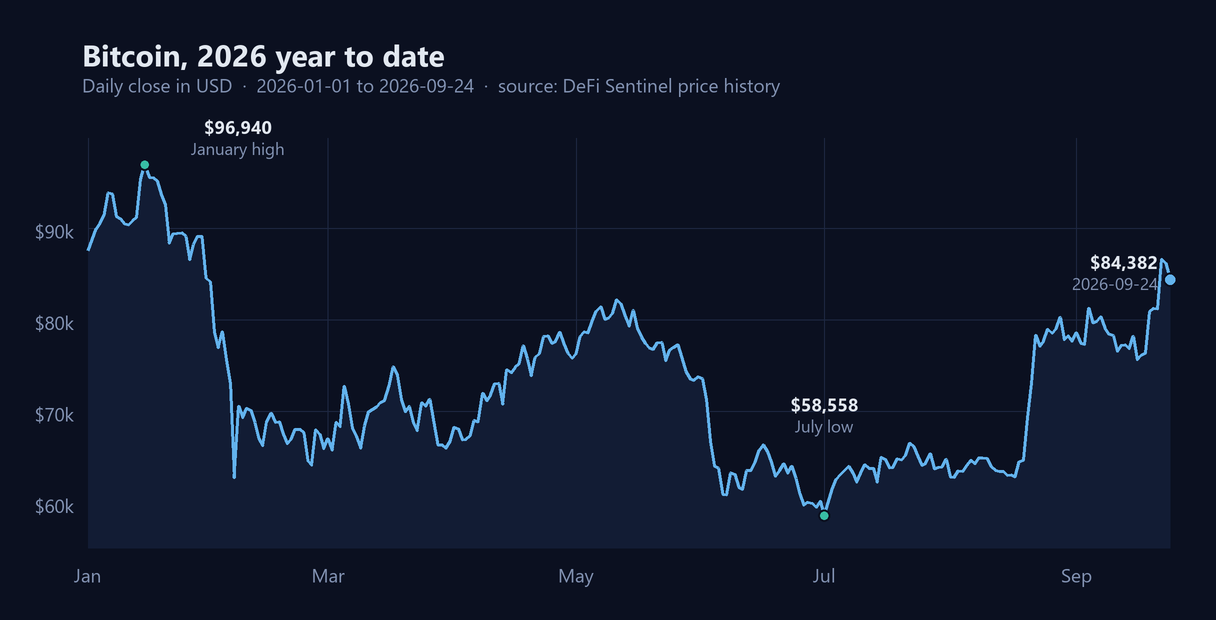 Bitcoin, year to date. The July low was $58,558. The recovery from it took about six weeks and gave very little of itself back.
On 15 September the CLARITY Act — the market-structure bill the industry spent years and hundreds of millions of dollars on — failed its Senate cloture vote 49–50, needing 60.
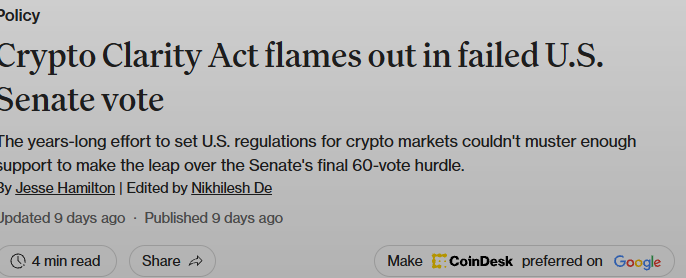 The single biggest lobbying effort in the industry's history, and it did not move price.
The next day the Fed hiked for the first time in three years, unanimously, with sixteen of eighteen officials penciling in another before year end.
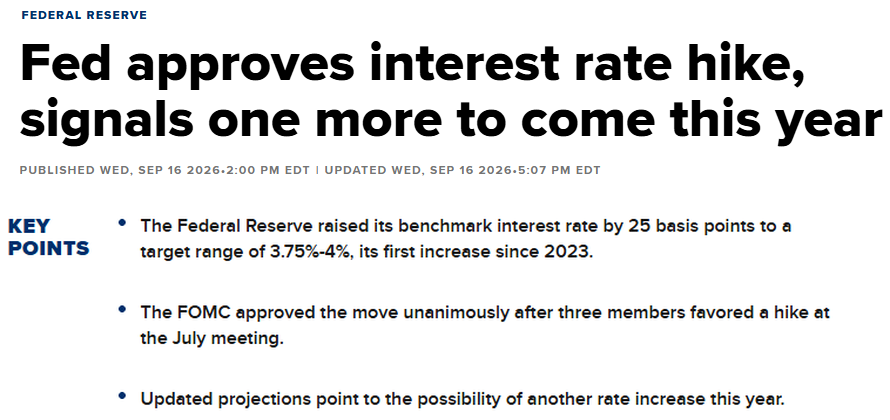 A hiking Fed is the condition every yield below is measured against — and the reason the floor moved.
Either would ordinarily be a reason to sell. Bitcoin instead closed at $84,382 on 24 September, in the mid-$80,000s and near its highest since late January, up roughly a third over three months, on about $2B of spot ETF inflows and a short squeeze through $84,000–85,000. The failed bill was largely priced before the vote; so was the hike. When bad news stops working, the seller is gone — the same observation we made in August, still holding.
It is not euphoria yet, and there is a clean way to check. Aave's stablecoin borrow rate is around 4.5%. In a genuine mania it runs 8–10%, because leveraged buyers bid for dollars regardless of price. Borrow demand is the least sentimental sentiment gauge available, and right now it says early rather than late. That matters more than it sounds: it is also why none of the levered positions in this guide are worth paying for. Cheap borrow is usually the argument for looping. Here it is the argument that the market has not yet reached the stage where looping gets rewarded.
One housekeeping note on our own work: the DeFi Sentinel Index reaches its first constituent review in the second half of October. Expect additions and removals.
Sorted by Safety Score, not by yield. That ordering is the point — a rate aggregator can tell you what a position pays, and none of them will tell you whether to take it.
| Safety | Position | APY | Risk | Where the yield comes from |
|---|---|---|---|---|
| 94 | Aave v3 Supply USDT (Ethereum) Ethereum | 3.69% | Medium | 3.69% USDT Lending Interest |
| 92 | Fluid Lending USDT (Ethereum) Ethereum | 4.30% | Medium | 4.30% Lending APY |
| 90 | PT-sUSDS (Ethereum) Nov 2026 Ethereum | 4.87% | Medium | 4.87% Fixed PT Yield |
| 88 | LP-sUSDS (Ethereum) Nov 2026 Ethereum | 5.40% | Medium | 3.60% Underlying Yield · 1.03% Swap Fees · 0.49% PENDLE Rewards |
| 80 | PT-USDai (Arbitrum) Oct 2026 Arbitrum | 10.04% | Medium | 10.04% Fixed PT Yield |
| 75 | PT-sUSDai (Arbitrum) Oct 2026 Arbitrum | 12.31% | Medium | 12.31% Fixed PT Yield |
| 71 | LP-reUSD (Ethereum) Dec 2026 Ethereum | 9.40% | Medium | 7.05% Underlying Yield · 0.06% Swap Fees · 0.31% PENDLE Rewards |
| 67 | PT-reUSDe (Ethereum) Dec 2026 Ethereum | 19.76% | Medium | 19.76% Fixed PT Yield |
| 59 | PT-apyUSD (Ethereum) Nov 2026 Ethereum | 15.61% | Medium | 15.61% Fixed PT Yield |
| 42 | PT-sUSDat (Monad) Jan 2027 Monad | 17.45% | Medium | 17.45% Fixed PT Yield |
Live from the DeFi Sentinel strategy database, sorted by Safety Score — not by yield. Rates move daily; verify before investing.
These numbers are read live from our strategy database, so they are the same figures the strategies page shows and they are never frozen at publication. The judgement below them is what changes monthly.
| Since September | Change | Why it matters |
|---|---|---|
| The floor | Moved up, and moved off-chain | The Fed hiked to 3.75–4.00%. On-chain money markets pay roughly policy; X Money and Aave's consumer app pay 6% with no protocol risk at all. The hurdle every row below has to clear rose by about two points, and the cheapest way to clear it now involves no DeFi |
| USD.AI | Same call, different instrument | In September we said buy the YT. It has since repriced sharply higher and the season ends 15 October. The trade now is to mint rather than buy — same points, none of the price risk |
| APYX | Our call was tested, and it held | We said a fixed 13 October TGE removed the timing risk. On 23 September Apyx postponed it indefinitely and raised Season 2 from 6% to 9%. We had the date wrong and the position right: staying out cost nothing, and a longer season at a larger allocation is still a longer season |
| STRC | Repaired, quietly | The dividend is now 12.00% and management intends to hold it there until the price sustains near par. STRC was $98.91 on 24 September against roughly $97.48 in early-September repurchases. The collateral improved while the wrapper on top of it slipped |
| sUSDS on Pendle | Added to the board | Sky is paying $30,000 a week into the November maturity across its full life. Short-dated, high-scoring, and the subsidy is disclosed and bounded rather than discovered later |
| Re | Held — and we were framing the risk wrongly | We discussed this position around hurricane season. The strategy breakdown shows property is only 18% of the book: 40% is small-business commercial and 29% commercial auto, both liability lines. The position is unchanged and so is the call, but the thing to watch is social inflation and loss trend, not storm tracks. Correction below |
| Leverage | Still not worth paying for, for a new reason | Last month the reason was that fixed-rate rows paid comparable money without a liquidation price. This month there is a second one: borrow at 4.5% is what an early market looks like, not an opportunity. Both looped positions stay off the board |
The mechanism. You supply a stablecoin, borrowers pay a utilization-driven rate, you take it. No maturity, no leverage, no token you have to model. It is the least interesting row here and the most important one, because it is the alternative to every other row.
The same dollar still earns different money. Supplying USDT to Aave v3 pays 3.69%; supplying the same USDT to Fluid pays 4.30%, at scores of 94 and 92. That spread is a utilization difference between two venues, not a subsidy and not a credit premium. It is the cheapest improvement in this guide, and most people leave it on the table out of habit.
The uncomfortable part is that neither clears 6%. X Money pays 6.00% APY to Premium+ subscribers, or to anyone receiving $1,000 or more in qualifying direct deposits within 34 days; Aave's iOS savings app pays a 6% base with a further 0.5% for automatic monthly deposits, and is still gated behind a waitlist you can join now. Both are custodial consumer products with their own trade-offs — account terms, jurisdiction limits, a provider that can change the rate at will — but neither carries smart-contract risk, and both currently pay more than lending on-chain does. If you are holding idle dollars purely for yield, start there, and treat every row below as something you take because it pays more than 6%, not because it is DeFi.
These rates float, and they track policy in both directions. With sixteen of eighteen FOMC participants expecting another hike, this row is likelier to rise than fall in the near term — which is what makes the fixed-rate rows below a decision rather than a default.
The mechanism. Fixed-rate exposure to USD.AI's GPU-backed lending book. Loans are collateralised by compute hardware, so the underwriting question is whether GPU rental rates hold.
The two assets are two different trades. USDai is the plain dollar, backed by PYUSD and Treasuries; it carries no GPU credit exposure by itself. Its PT pays 10.04% and scores 80. sUSDai is the staked version that takes the loan-book risk directly; its PT pays 12.31% and scores 75. That step is the decision, and it is a clean one.
Prefer October to February in both cases. February pays 6.93% on USDai and 10.00% on sUSDai. When the term structure is flat or inverted, duration is a risk nobody is paying you for. A PT converges to its underlying 1:1 at maturity, so holding to the date removes price risk entirely; selling early does not.
This is the specific, dated opportunity in this edition, and it is gone after 15 October.
USD.AI's Season 2 (Flatiron) ends on 15 October — the same day Pendle's October USDai markets mature. That alignment is what makes the trade work.
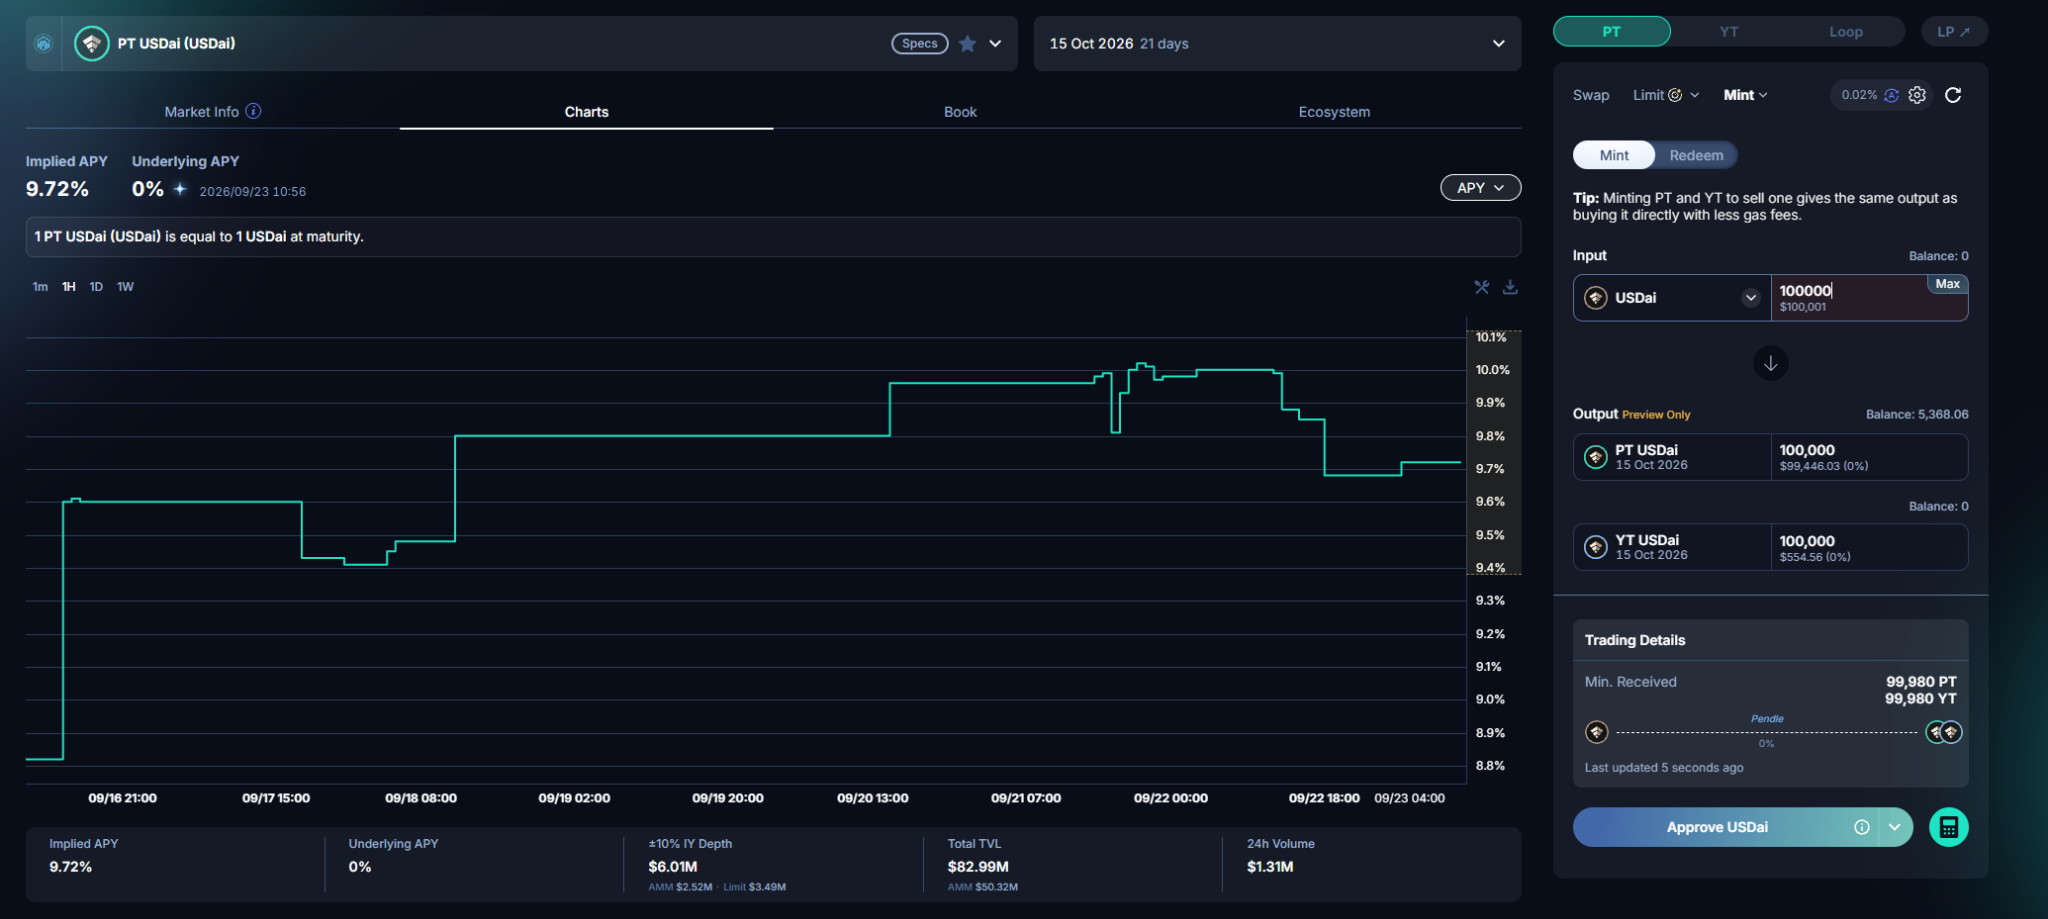 Minting splits the dollar without spending it. The PT holds the principal; the YT holds three weeks of yield — and all of the points.
Minting on Pendle splits one unit of the underlying into one PT and one YT — the Yield Token, which collects everything the position earns until maturity and is worth zero afterwards. Crucially, PT + YT together are the underlying: you can redeem the pair at any time, and at maturity the YT's remaining value simply reappears in the PT. Total value does not change when you mint. What changes is the points multiplier attached to what you hold.
Concretely, at the time of the screenshot, $100,000 of USDai minted into 100,000 PT (worth $99,446) and 100,000 YT (worth $555). Holding plain USDai earns Allo points at 8× on our USD.AI calculator. Holding the YT earns 25×. Same dollar, same issuer, same day — roughly three times the points, for one mint transaction and gas.
Run the arithmetic on $100,000 for the three weeks to 15 October and you get on the order of 50 million points. At the valuation our calculator currently implies — CHIP's market capitalisation with a 5% season allocation, about $20 per million — that is roughly $1,000, or about 1% of principal, annualising near 17%.
This is a very low-risk trade, and it is worth being precise about why. Your market exposure does not change at all, because you hold both legs and the pair redeems back to the underlying at any time. So the entire risk surface is two things: PYUSD, which is what USDai is backed by, and Pendle's contracts, which is where the mint happens. Both are about as solid as DeFi gets — a regulated, fully reserved dollar and the most battle-tested yield-splitting protocol on-chain. You are not touching the GPU loan book at all in this trade; that is what makes USDai rather than sUSDai the right leg. The one genuinely uncertain number is CHIP's eventual valuation — $20 per million is our calculator's current implication, not a fact, and it is the entire return rather than the principal. Model it yourself before committing.
Two more things, and both cut in your favour this month. USD.AI has joined Fluid's looping incentive programme and deployed to Solana, which has pulled in additional TVL — ordinarily new deposits mint new points and dilute yours, but with under a month left in the season there is not enough runway for that to matter. And if you are weighing the sUSDai version instead, note its YT multiplier is 12× rather than 25× — the plain dollar is both the safer leg and the better points vehicle here, which is unusual and worth knowing.
(Our USD.AI referral link is app.usd.ai/i/UT8X0, if you find this guide useful.)
A second, smaller one. When a USDai or sUSDai pool has about a week left, large holders begin moving to the next maturity, and that flow is predictable. Buying the February 2027 PT before the migration and selling into it usually works. It is a liquidity trade, not a yield trade, and it is only worth the effort at size.
What breaks the credit position: sustained H200 rental rates falling toward $2/hour, which would mean the collateral is repricing rather than any single borrower struggling. The second-order risk is faster: the book has grown quickly, and a loan book that grows quickly is a loan book underwriting borrowers it met recently.
Brought to you by DeFi Sentinel.
This guide is the free tier. Pro membership is $9.90 a month, and it is where the workings live:
- The full research library — every Member Only report, including the rating writeup behind each protocol and asset score on the board above.
- Advanced risk analytics — the complete Safety Score derivation: the weakest-link protocol score, the weakest-link asset score, and every execution multiplier that discounts the final number. You see why a position scores 42 instead of 75, not just that it does.
- Real-time strategy alerts — when a rate moves, an incentive ends or a risk profile changes, you hear about it then, not in next month's edition. That matters most on exactly the rows this guide flags as subsidised.
- Real-time arbitrage alerts — funding-rate and basis opportunities as they open.
- Step-by-step strategy walkthroughs — the full deposit flow for every position, including the bridges and cooldowns that make a trade awkward to leave.
- The weekly newsletter, priority support, and an ad-free site.
Payment is USDC on-chain and mints a soulbound badge to your wallet — no card, no recurring charge to cancel. See what is included →
Want to sponsor a future edition of the DeFi Yield Guide? Email [email protected].
New on the board this month. Sky's savings dollar, fixed or floating, on a maturity seven weeks out.
The mechanism. sUSDS accrues the Sky Savings Rate. On Pendle you can take that fixed through the PT at 4.87% (score 90), or floating through the LP — the liquidity-provider leg, which earns swap fees and incentives instead of a locked rate — at 5.40% (score 88). These are the two highest-scoring non-money-market rows on the board.
Why now: Sky is paying $30,000 a week into this pool across its full maturity. On a pool this size that is a large fraction of what the LP earns, and it is exactly the case the incentive rule was written for. The subsidy is disclosed, it is fixed in dollars, and it ends with the maturity — which makes it the honest kind. Size the position for the base rate and treat the campaign as the reason the next seven weeks are better than the seven after them.
Read the LP rate as a range, not a number. A fixed dollar subsidy divided by a moving pool balance, plus swap fees that arrive in bursts, makes this row genuinely volatile: over the seven days to 25 September the pool averaged close to 10%, while the spot reading above is whatever the last sync caught. Neither is wrong — the trailing average is the better guide to what you will actually earn over seven weeks, and the spot print is the better guide to how much the number moves. The PT alongside it exists precisely for readers who would rather not think about that.
What breaks it: dilution. Incentive APR falls as deposits arrive, so the rate you see today is not the rate a large late entrant gets. The LP also carries the usual asymmetry against the PT: if you need to exit before November, you exit at whatever the pool quotes.
The mechanism. On-chain reinsurance premiums. Re writes real insurance risk and funds it with stablecoin deposits split into two tranches. reUSD is senior and reUSDe is junior — the junior tranche absorbs losses first, and only when it is wiped out does the senior take any. The several-point step between them is not a bonus. It is the price of sitting lower in the loss waterfall, quoted honestly.
Senior via the LP pays 9.40% at a score of 71. Junior via the PT pays 19.76% at 67.
On the junior leg, take the PT over the LP. They price within about a point of each other — the LP is at 18.92% — and when fixed and floating pay the same, fixed is strictly better: the PT locks your return the moment you buy, while the LP's depends on pool utilization for the remaining months. That is certainty offered for free.
Look at what this book actually writes — it is not catastrophe cover. We framed this position around hurricane season last month. The strategy breakdown says otherwise, and it is worth correcting in public:
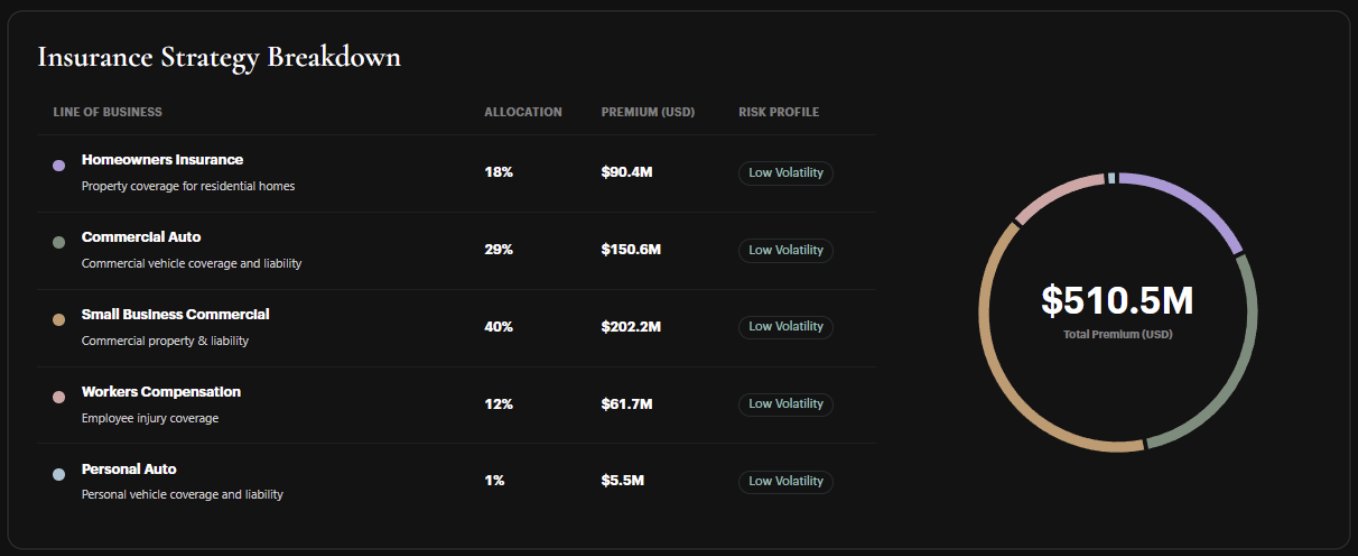 $510.5M of premium. Property is 18% of it. The other 82% is commercial liability, fleets and injured workers.
Small Business Commercial is 40% of the book at $202.2M, Commercial Auto 29% at $150.6M, homeowners only 18%, workers' comp 12%. That is a high-frequency, low-severity attritional book, which is why every line is tagged Low Volatility — no single event wipes it out. It also means the risk is trend, not weather, and trend is slower, more predictable, and much easier to watch than a storm track.
So here is what to actually watch, and it is not the National Hurricane Center.
What breaks it: a PT fixes the yield, not the credit, and a bad year means redemption below par with junior taking it first. But the realistic failure here is not a single catastrophe — it is loss trend outrunning the premium: a few large liability verdicts landing inside a book this size, or reserve releases drying up, grinding the combined ratio through 100 and eating the tranche's margin from below. That is slower than a hurricane and easier to see coming. It is also less likely to be priced in advance, because it does not arrive on a date.
The mechanism. Both are synthetic dollars collateralised by dividend-bearing preferred shares, dominantly STRC — Strategy's variable-rate perpetual preferred, designed to hold a $100 par. Apyx wraps it as apxUSD/apyUSD; Saturn wraps it as USDat/sUSDat. You are being paid the preferred's dividend, levered by the wrapper's structure, minus whatever the market charges for the wrapper's own risk.
The collateral got better this month and the wrappers did not. STRC's dividend is now 12.00%, and Strategy has committed to holding it there until the price sustains near par; it closed at $98.91 on 24 September. The repurchase programme is funded from the USD reserve rather than from Bitcoin sales, which is the distinction that matters to anyone holding a claim on that dividend.
The dividend coverage is the number to check, and it is checkable. Strategy publishes the whole balance sheet:
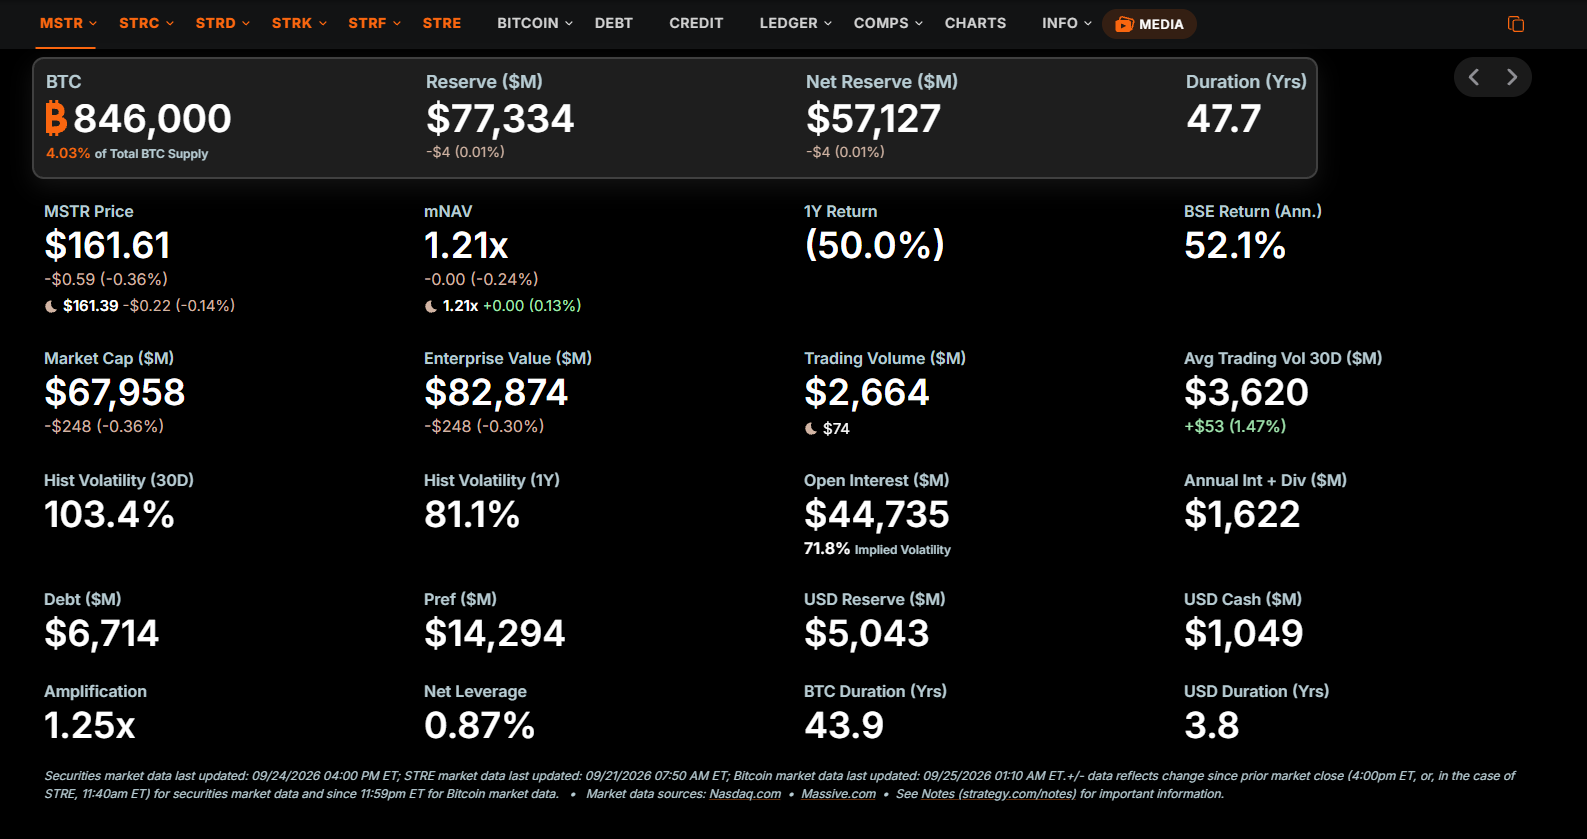 The line that matters to a wrapper holder is bottom-right: 3.8 years of USD duration.
Annual interest plus preferred dividends run $1,622M. Against that sit a $5,043M USD reserve and $1,049M of USD cash — about 3.8 years of obligations pre-funded in dollars, which is what the dashboard's "USD Duration" figure states directly. That is the answer to "can they keep paying 12%": for roughly four years, without selling a single Bitcoin, yes. Preferred outstanding is $14,294M against $6,714M of debt, and MSTR trades at a 1.21× premium to its 846,000 BTC — that premium is the arbitrage room the whole structure depends on, and it is what lets them issue into strength rather than liquidate into weakness.
Against that: Apyx postponed its TGE on 23 September citing precisely this asset class's volatility, and apxUSD has traded as low as $0.90 on a single STRC drawdown. The collateral is more solid than the things built on top of it. That asymmetry is the trade, and it is also the warning.
PT-apyUSD, November, on Ethereum pays 15.61% at a score of 59. It needs no bridge — you swap into apyUSD on mainnet and buy the PT. With the TGE now undated, the airdrop-proximity argument for holding the YT has evaporated; the PT is the only leg of this market we would touch. Season 2 keeps accruing at a larger 9% allocation, which helps anyone already in — but a bigger share of an unscheduled event is not a trade. APYX calculator.
PT-sUSDat, January, on Monad pays 17.45% at a score of 42 — the highest rate on the board and the lowest score, which is not a coincidence. A meaningful part of what it pays above the underlying is Monad subsidising liquidity onto its own chain, not Saturn earning more. Apply the incentive rule: size it for the day the subsidy stops. You also have to bridge, and the bridge is the part people underestimate. If you want the unlevered version, holding sUSDat directly pays 13.80% and also accrues Saturn points — though Saturn's season runs to December, too far out to bound the uncertainty the way USD.AI's does. Saturn calculator.
What breaks it: an STRC depeg — and the wrappers move more than the collateral does. Add a roughly 20-day cooldown on unwinding apyUSD, and a young asset we have not yet rated. Small position, checked often.
The uncomfortable conclusion of a yield guide: at these levels, spot is still competitive with most of the board.
Bitcoin in the mid-$80,000s reaching $100,000 within a year is about 18%. That is a thinner edge than the 25% we wrote about last month at $77,000 — we called the bottom near $64,000, kept the call at $77,000, and the arithmetic has now compressed twice in two months. We are still constructive, and we are saying plainly that the easy part is behind us. The safest rows on this board pay roughly the policy rate. The ones paying more carry credit risk you have to monitor, or a liquidation price.
Where the durable money is in a bull market, in rough order of how defensible we think each is:
Where it is not: memecoins, and the launchpad economy on each new chain. Robinhood's chain, Arc, and whatever is next are all versions of the same structure, and the structure does not build anything. The number worth remembering is this one: DefiLlama tracks over 5,000 DeFi protocols. We list 230. The gap is not selectivity for its own sake — below roughly $50M of TVL, most of what remains is already dead. Deposits nobody remembers, a Telegram group silent for months, a team that stopped tweeting, sometimes a front end that no longer loads. The money in those contracts is not earning; it is stranded. Age and survivorship are underrated filters, and they cost nothing to apply.
Informational only, not financial advice. Yields, maturities, borrow rates and risk conditions change quickly — verify current figures on-chain before investing, and never commit more than you can afford to lose.
As of October 2026 it is still the fixed-rate Pendle PT on USD.AI's October market — high single digits on the backed dollar, low double digits on the staked version, at Safety Scores in the 70s and 80s. The loans behind it are secured by GPUs that are renting out faster than they can be built. But note the floor has moved: with the Fed at 3.75–4.00%, custodial consumer accounts pay 6% with no smart-contract risk, so anything in DeFi paying less than that has to justify itself on something other than the rate.
A 0-100 grade for a yield position, not a protocol. It combines the ratings of every protocol and asset the position touches, then applies multipliers for what makes a position more fragile than its parts: leverage, unwind cooldowns, bridge dependencies, and young unrated assets. A score in the 40s is not a warning label — it is a statement that the position can lose principal in ways a score in the 80s cannot.
Take the PT. A PT locks your return the moment you buy it, while an LP's return depends on pool utilization and trading volume for the remaining months. When the fixed and floating legs price within a fraction of a point of each other, you are being handed certainty at no cost. The caveat: a PT fixes the yield, not the credit — the underlying can still redeem below par.
Rarely, and only when both legs are unusually benign and the unlevered alternatives pay materially less. As of October 2026 we carry no looped position on the board — fixed-rate positions pay comparable money with no liquidation price attached, and a stablecoin borrow rate near 4.5% is a sign the market is early rather than an opportunity, since in a genuine mania it runs 8–10%. What breaks a loop is almost never the collateral; it is the borrow rate, a utilization curve that can double in a week. Without an e-mode buffer, the borrow cap and the liquidation price are the same number.
Compare the rate to what the underlying asset earns on its own. If a position pays triple its underlying, the difference is not yield — it is someone buying liquidity, usually a chain or a protocol bootstrapping its ecosystem. That is withdrawable at will and with no notice. An incentive is not disqualifying, but you should size the position for the day the subsidy stops, not the day it is running.
Only as a speculative sleeve, never as income, and often there is a cheaper way to get the same points. YT decays to zero, so a disappointing airdrop costs you most of the stake — which is why we assign points positions no Safety Score at all. Before buying a YT, check whether you can mint instead: minting the underlying on Pendle gives you the PT and the YT together, which is economically identical to just holding the asset, while the YT leg carries the higher points multiplier. That collects the points without paying the YT's premium. If you do buy, prefer markets expiring on or before the airdrop date and model a conservative FDV drawdown first.
Often, yes — and a yield guide should say so. When the safest stablecoin rows pay roughly the policy rate and the exciting ones pay 6–20% with credit or liquidation risk attached, a plausible move in spot competes with all of them. As of October 2026, bitcoin in the mid-$80,000s reaching $100,000 within a year is about 18% — a thinner edge than the 25% the same arithmetic gave at $77,000 a month earlier, which is what taking a directional call twice in a row looks like. Treat DeFi yield as the part of the portfolio that should not move, and take directional risk where you can actually see it.

Practitioner turned analyst tracking how incentives, liquidity, and capital flows shape DeFi protocols.